Umbral de color

Escrito por
8 minutos de lectura
Color Threshold
import matplotlib.pyplot as plt
import numpy as np
import cv2
# Read in the image
imgUrl = "../../assets/1.Image-Representation-Classification/"
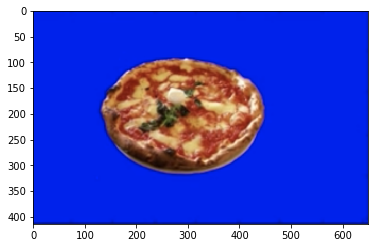
image = cv2.imread(imgUrl + "pizza-blue-bg.png")
# Print out the type of image data and its dimensions
print("This image is: ", type(image), "with dimensions: ", image.shape)
This image is: <class 'numpy.ndarray'> with dimensions: (414, 650, 3)
%matplotlib inline

# Make a copy of the image
image_copy = np.copy(image)

# Change color to RGB (from BGR)
image_copy = cv2.cvtColor(image_copy, cv2.COLOR_BGR2RGB)

# Display the image
plt.imshow(image_copy)
<matplotlib.image.AxesImage at 0x7f98ea04c4a8>
Define the color threshold
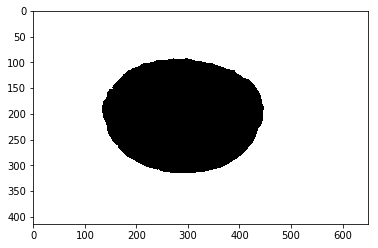
# Define our color selection boundaries in RGB values
lower_blue = np.array([0, 0, 100])
upper_blue = np.array([100, 100, 255])
Create a mask
# Define the masked area
mask = cv2.inRange(image_copy, lower_blue, upper_blue)

plt.imshow(mask, cmap="gray")
<matplotlib.image.AxesImage at 0x7f98ea6ae5f8>
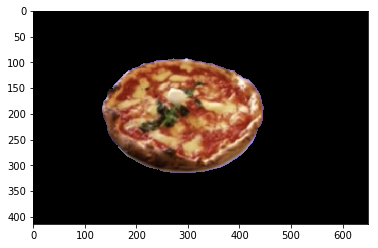
# Mask the image to let the pizza show through
masked_image = np.copy(image_copy)

masked_image[mask != 0] = [0, 0, 0]

plt.imshow(masked_image)
<matplotlib.image.AxesImage at 0x7f98ea0435c0>
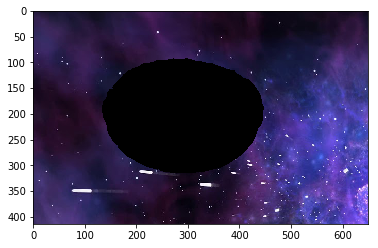
Mask and add a background image
# Load in a background image, and convert it to RGB
bg_img = cv2.imread(imgUrl + "/space-bg.jpg")
bg_img = cv2.cvtColor(bg_img, cv2.COLOR_BGR2RGB)
# Crop it to the right size (414, 650)
crop_bg = bg_img[0:414, 0:650]
# Mask the cropped background so that the pizza area is blocked
crop_bg[mask == 0] = [0, 0, 0]
# Display the background
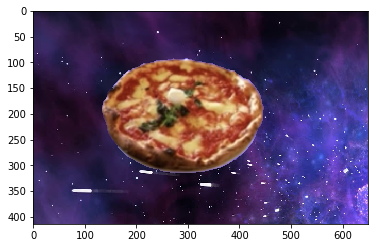
plt.imshow(crop_bg)
<matplotlib.image.AxesImage at 0x7f98e9dd8630>
# Add the two images together to create a complete image
complete_image = crop_bg + masked_image

plt.imshow(complete_image)
<matplotlib.image.AxesImage at 0x7f98ea172ba8>
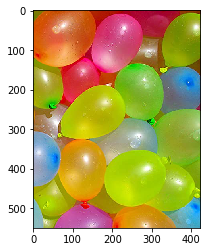
HSV Color Space, Balloons
%matplotlib inline

image = cv2.imread(imgUrl + "/water_balloons.jpg")
image = cv2.cvtColor(image, cv2.COLOR_BGR2RGB)

plt.imshow(image)
<matplotlib.image.AxesImage at 0x7f98ea1a38d0>
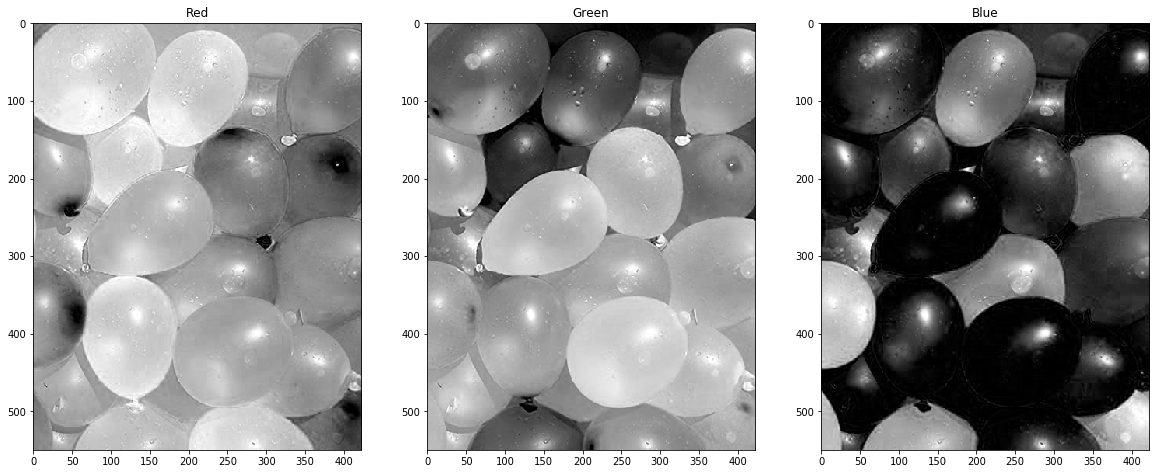
Plot color channels
# RGB channels
r = image[:,:,0]
g = image[:,:,1]
b = image[:,:,2]

f, (ax1, ax2, ax3) = plt.subplots(1, 3, figsize=(20,10))

ax1.set_title('Red')
ax1.imshow(r, cmap='gray')

ax2.set_title('Green')
ax2.imshow(g, cmap='gray')

ax3.set_title('Blue')
ax3.imshow(b, cmap='gray')
<matplotlib.image.AxesImage at 0x7f98e81d6cc0>
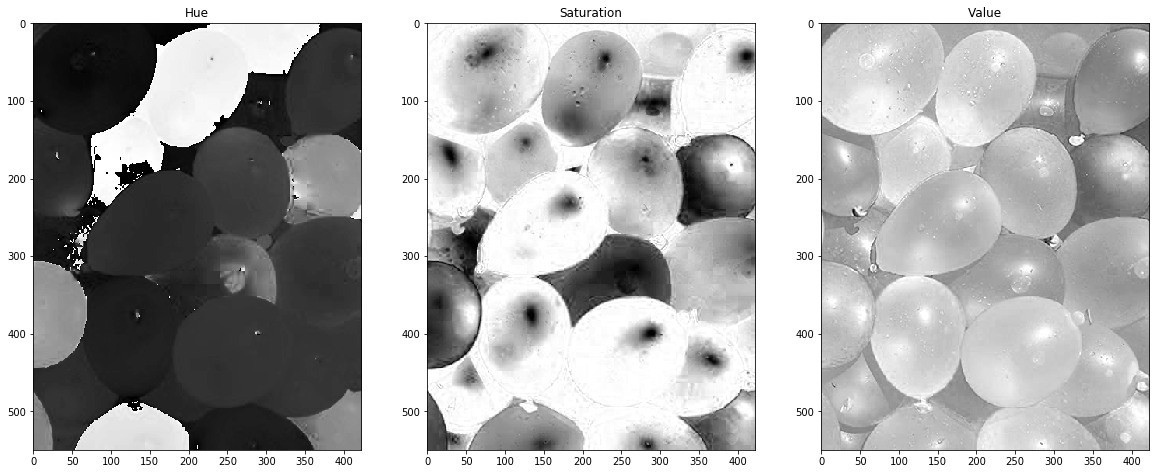
# Convert from RGB to HSV
hsv = cv2.cvtColor(image, cv2.COLOR_RGB2HSV)

# HSV channels
h = hsv[:,:,0]
s = hsv[:,:,1]
v = hsv[:,:,2]

f, (ax1, ax2, ax3) = plt.subplots(1, 3, figsize=(20,10))

ax1.set_title('Hue')
ax1.imshow(h, cmap='gray')

ax2.set_title('Saturation')
ax2.imshow(s, cmap='gray')

ax3.set_title('Value')
ax3.imshow(v, cmap='gray')
<matplotlib.image.AxesImage at 0x7f98ea449208>
Define pink and hue selection thresholds
# Define our color selection criteria in HSV values
lower_hue = np.array([150,0,0])
upper_hue = np.array([174,210,255])
# Define our color selection criteria in RGB values
lower_pink = np.array([180,0,100])
upper_pink = np.array([255,255,230])
Mask the image
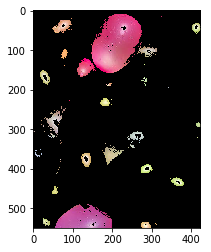
# Define the masked area in RGB space
mask_rgb = cv2.inRange(image, lower_pink, upper_pink)

# mask the image
masked_image = np.copy(image)
masked_image[mask_rgb==0] = [0,0,0]

# Vizualize the mask
plt.imshow(masked_image)
<matplotlib.image.AxesImage at 0x7f98ea6e7ba8>
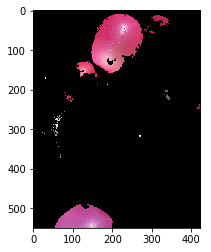
# Now try HSV!

# Define the masked area in HSV space
mask_hsv = cv2.inRange(hsv, lower_hue, upper_hue)

# mask the image
masked_image = np.copy(image)
masked_image[mask_hsv==0] = [0,0,0]

# Vizualize the mask
plt.imshow(masked_image)
<matplotlib.image.AxesImage at 0x7f98ea76d198>
¿Quieres contactar conmigo?
Reporta un bug
Para cualquier error en la web o en la escritura, porfavor abre un issue en Github.
GithubMándame un mensaje
Siéntete libre de mandarme un tweet con cualquier recomendación o pregunta.
Twitter